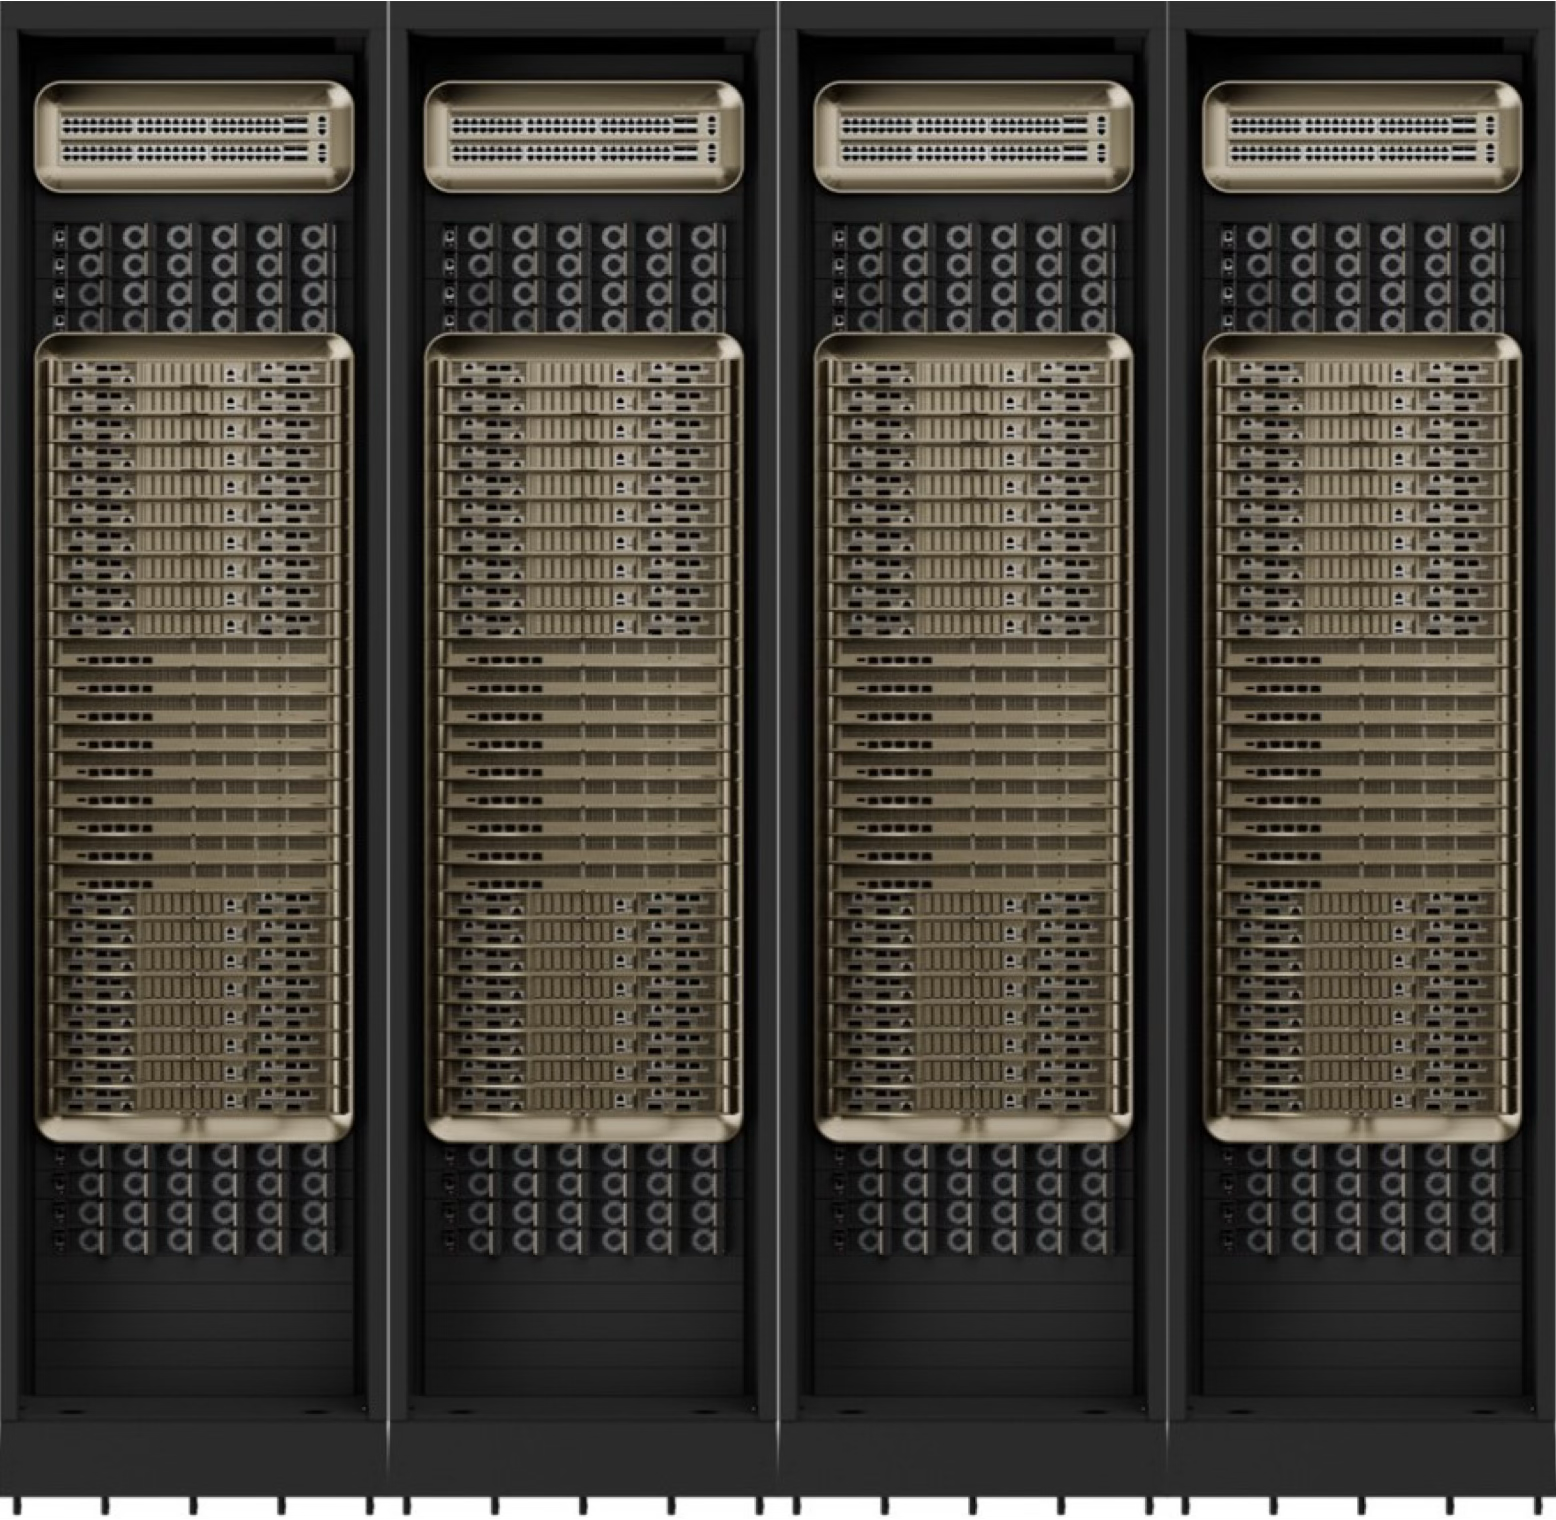
Data-center AI cluster, rack simulator
Sizing an AI data center that stays relevant for 5-10 years requires navigating aggressive hardware roadmaps, evolving model architectures, and uncertain workload mixes. Decisions on GPUs, fabrics, and rack counts are costly to reverse, so teams need a quick way to stress-test assumptions before committing capital.
To support that planning, we built a rack-scale throughput estimatora nd initial data-center simulator that models how large language models run across multiple data-center racks. The simulator sweeps tensor, pipeline, and expert parallelism, explores 4/8/16-bit quantisation, and reports sustained decode throughput along with the limiting subsystem (compute, HBM, or fabric).
Out of the box we include eight-rack presets for:
- NVIDIA GB200 NVL72 cabinets
- NVIDIA GB300 NVL72 cabinets (projected)
- AMD MI300X OAM racks
- AMD MI355X OAM racks (projected)
The default workload is Qwen3-235B, a state-of-the-art open-source large-language-model (LLM) model suitable for high-scale inference.
Everything is open for inspection and extension. Clone the repository, run the simulator, and contribute improvements at github.com/culurciello/dc-simulator.
Why this models?
Many startup companies and incumbents in the field of AI applications use large language models (LLMs) to run inference at scale. However, data center providers such as Azure, AWS, and Vultr often abstract scaling parameters and infrastructure so heavily that it becomes difficult to optimize for inference performance or accurately estimate monthly operational costs.
In addition, this abstraction limits visibility into key factors such as GPU utilization efficiency, network latency, and storage throughput—parameters that directly affect both cost and responsiveness. Without fine-grained control or transparency, teams struggle to design cost-effective scaling strategies, especially for workloads that experience variable demand or require low-latency responses.
We decided to investigate the scaling behavior of inference on the latest AI LLM models, such as Qwen3, to better understand the performance–cost trade-offs across different deployment environments. Our goal is to measure how inference latency, throughput, and GPU utilization scale with model size, batch size, and concurrent user load.
By running controlled experiments across multiple infrastructure providers and hardware configurations, we aim to quantify how efficiently these models can be served under real-world conditions. This includes evaluating containerized deployments, quantized model variants, and distributed inference frameworks. The results should highlight practical limits of current scaling abstractions and inform strategies for cost optimization and hardware selection in production environments.
Simulation detailed results
The optimiser landed on batch 12 for every preset; tokens/GPU flatten beyond that point because each rack is compute-bound.
Batch-12 optima by quant level
| Preset | q4 Total TPS | q8 Total TPS | q16 Total TPS | Dominant Limit | Best TPxPPxEP |
|---|---|---|---|---|---|
| NVIDIA GB200 NVL72 | 182,460 tok/s | 173,182 tok/s | 154,627 tok/s | compute | 1x1x{1,2,8} |
| NVIDIA GB300 NVL72 | 243,280 tok/s | 230,910 tok/s | 206,170 tok/s | compute | 1x1x{1,2,8} |
| AMD MI300X OAM Rack | 77,714 tok/s | 73,763 tok/s | 65,860 tok/s | compute | 1x1x{1,2,8} |
| AMD MI355X OAM Rack | 97,988 tok/s | 93,005 tok/s | 83,041 tok/s | compute | 1x1x{1,2,8} |
The brace notation highlights the expert-parallel degree chosen for each quant level (1 for 4-bit, 2 for 8-bit, 8 for 16-bit).
Interpretation
Computation on each GPU was the primary limiting factor in overall inference performance. Interestingly, communication bandwidth across the interconnect fabric was largely underutilized. The measured Fabric Load per Instance (GB/s) for all three cases—intra-node, inter-node, and inter-rack—was effectively zero.
This suggests that the inference workload was dominated by local GPU computation rather than data exchange between GPUs or across racks. In other words, scaling inefficiencies were not caused by communication bottlenecks but rather by the computational intensity of the model itself. This finding implies that optimizing kernel efficiency, tensor parallelism, or GPU scheduling could yield larger performance gains than network-level optimizations in this setup.
The communication infrastructure is underutilized because it is primarily designed to sustain training workloads, which require extensive data and gradient exchange between GPUs. In contrast, inference workloads are far less communication-intensive, as most computations are localized to individual GPUs once the model weights are loaded. As a result, high-bandwidth interconnects such as NVLink or InfiniBand remain largely idle during inference runs.
This highlights a key mismatch between hardware design and inference requirements: data center clusters optimized for large-scale distributed training may not provide proportional efficiency when repurposed for inference at scale. Tailoring infrastructure for inference—through lighter interconnect fabrics, higher memory density per GPU, or improved batch scheduling—could significantly improve cost-performance ratios.
Insights
Inter-rack and inter-node communication can be optimized to become more adaptive and resource-aware, enabling the system to dynamically allocate compute and communication resources based on real-time workload demands. When computation becomes the bottleneck, the infrastructure should be able to source additional GPU or accelerator capacity with minimal communication overhead. Conversely, when communication is underutilized—as observed in our measurements—the system could reconfigure the network topology or downscale link utilization to operate more efficiently using lower-cost components and switches.
This flexibility would allow data centers to strike a better balance between performance and cost-efficiency. By decoupling inference communication requirements from training-oriented infrastructure design, future AI clusters could achieve higher utilization rates and reduced total cost of ownership (TCO) without compromising latency or throughput.
Detailed results
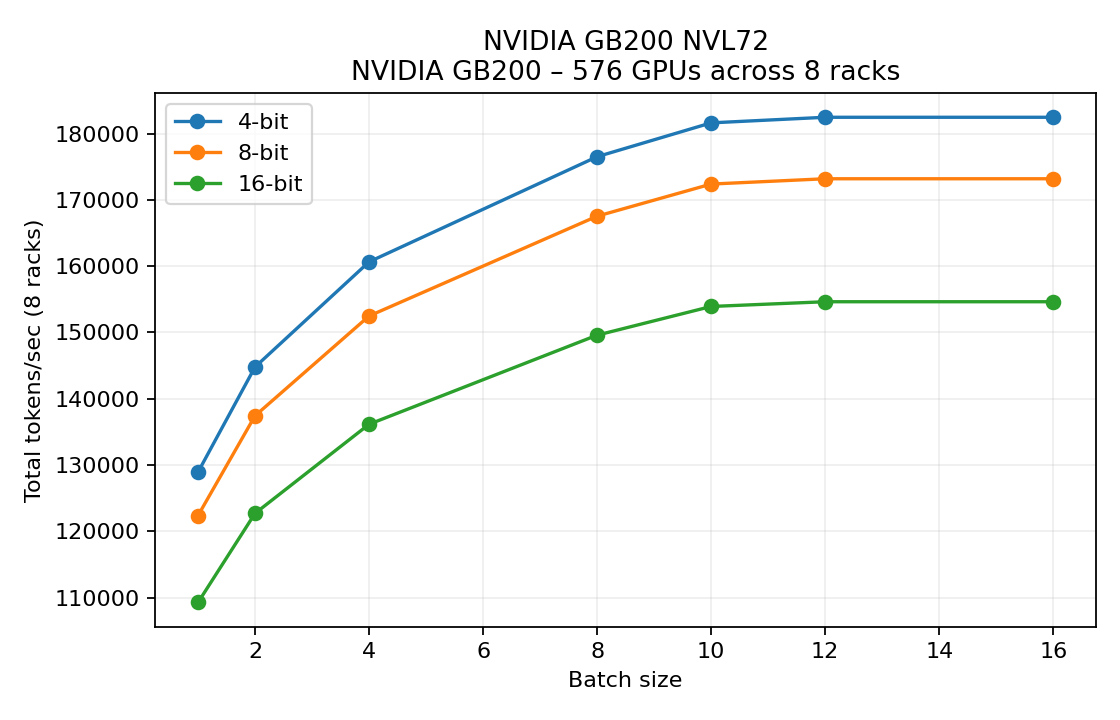
NVIDIA GB200 NVL72 (8 racks, 576 GPUs)
  Batch | Quant | Tok/GPU(avg) | Inst TPS | Tot TPS | #Inst | GPUs/Inst | TPxPPxEP | Mem/GPU (GB) | Limit | Fabric Load per Inst (GB/s intra/inter/rack) | Bounds tok/GPU(avg) (comp/hbm/comm)
----------------------------------------------------------------------------------------------------------------------------------------------------------------------------------------------
      1 |     4 |        223.81 |     223.81 |   128912.0 |   576 |         1 | 1x1x1 |       119.4 | compute |   0.0/  0.0/  0.0 |  344.3/1.43e+07/  inf
      2 |     4 |        251.35 |     251.35 |   144778.0 |   576 |         1 | 1x1x1 |       120.4 | compute |   0.0/  0.0/  0.0 |  344.3/1.43e+07/  inf
      4 |     4 |        278.90 |     278.90 |   160644.1 |   576 |         1 | 1x1x1 |       122.5 | compute |   0.0/  0.0/  0.0 |  344.3/1.43e+07/  inf
      8 |     4 |        306.44 |     306.44 |   176510.2 |   576 |         1 | 1x1x1 |       126.6 | compute |   0.0/  0.0/  0.0 |  344.3/1.43e+07/  inf
     10 |     4 |        315.31 |     315.31 |   181617.9 |   576 |         1 | 1x1x1 |       128.7 | compute |   0.0/  0.0/  0.0 |  344.3/1.43e+07/  inf
     12 |     4 |        316.77 |     316.77 |   182460.0 |   576 |         1 | 1x1x1 |       130.8 | compute |   0.0/  0.0/  0.0 |  344.3/1.43e+07/  inf
     16 |     4 |        316.77 |     316.77 |   182460.0 |   576 |         1 | 1x1x1 |       134.9 | compute |   0.0/  0.0/  0.0 |  344.3/1.43e+07/  inf
      1 |     8 |        212.43 |     424.85 |   122357.1 |   288 |         2 | 1x1x2 |       132.9 | compute |   0.0/  0.0/  0.0 |  326.8/5.35e+06/1.83e+07
      2 |     8 |        238.57 |     477.14 |   137416.4 |   288 |         2 | 1x1x2 |       134.3 | compute |   0.0/  0.0/  0.0 |  326.8/5.35e+06/1.83e+07
      4 |     8 |        264.71 |     529.43 |   152475.8 |   288 |         2 | 1x1x2 |       137.0 | compute |   0.0/  0.0/  0.0 |  326.8/5.35e+06/1.83e+07
      8 |     8 |        290.86 |     581.72 |   167535.1 |   288 |         2 | 1x1x2 |       142.5 | compute |   0.0/  0.0/  0.0 |  326.8/5.35e+06/1.83e+07
     10 |     8 |        299.28 |     598.55 |   172383.1 |   288 |         2 | 1x1x2 |       145.3 | compute |   0.0/  0.0/  0.0 |  326.8/5.35e+06/1.83e+07
     12 |     8 |        300.66 |     601.33 |   173182.4 |   288 |         2 | 1x1x2 |       148.0 | compute |   0.0/  0.0/  0.0 |  326.8/5.35e+06/1.83e+07
     16 |     8 |        300.66 |    1202.66 |   173182.4 |   144 |         4 | 1x1x4 |       105.4 | compute |   0.1/  0.0/  0.0 |  326.8/2.68e+06/9.16e+06
      1 |    16 |        189.67 |    1517.33 |   109247.4 |    72 |         8 | 1x1x8 |       112.4 | compute |   0.1/  0.0/  0.0 |  291.8/6.69e+05/4.58e+06
      2 |    16 |        213.01 |    1704.07 |   122693.3 |    72 |         8 | 1x1x8 |       115.1 | compute |   0.1/  0.0/  0.0 |  291.8/6.69e+05/4.58e+06
      4 |    16 |        236.35 |    1890.82 |   136139.1 |    72 |         8 | 1x1x8 |       120.6 | compute |   0.1/  0.0/  0.0 |  291.8/6.69e+05/4.58e+06
      8 |    16 |        259.70 |    2077.57 |   149584.9 |    72 |         8 | 1x1x8 |       131.6 | compute |   0.1/  0.0/  0.0 |  291.8/6.69e+05/4.58e+06
     10 |    16 |        267.21 |    2137.69 |   153913.5 |    72 |         8 | 1x1x8 |       137.2 | compute |   0.1/  0.0/  0.0 |  291.8/6.69e+05/4.58e+06
     12 |    16 |        268.45 |    2147.60 |   154627.1 |    72 |         8 | 1x1x8 |       142.7 | compute |   0.1/  0.0/  0.0 |  291.8/6.69e+05/4.58e+06
     16 |    16 |        268.45 |    2147.60 |   154627.1 |    72 |         8 | 1x2x4 |       105.4 | compute |   0.1/  0.0/  0.0 |  291.8/1.34e+06/4.58e+06
- 4-bit quantisation keeps each instance on a single GPU (TP=PP=EP=1), reaching 182 k tokens/s aggregate.
- Higher-precision runs increase expert parallelism to stay under the 192 GB memory cap while holding the rack compute bound.
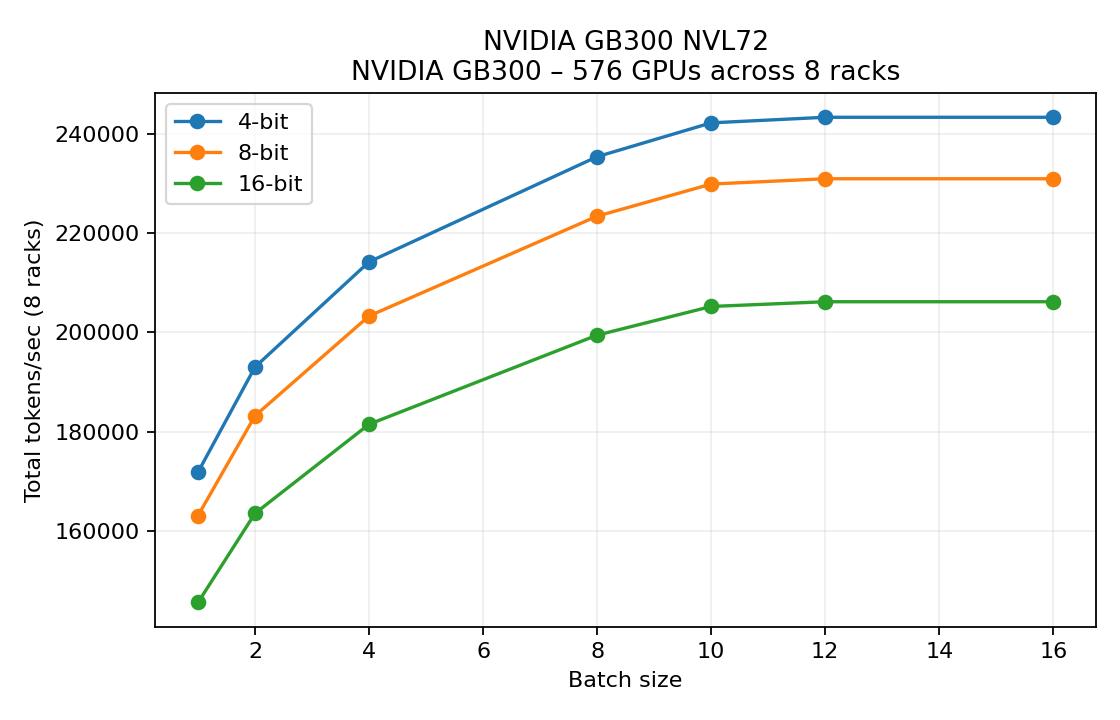
NVIDIA GB300 NVL72 (8 racks, 576 GPUs)
  Batch | Quant | Tok/GPU(avg) | Inst TPS | Tot TPS | #Inst | GPUs/Inst | TPxPPxEP | Mem/GPU (GB) | Limit | Fabric Load per Inst (GB/s intra/inter/rack) | Bounds tok/GPU(avg) (comp/hbm/comm)
----------------------------------------------------------------------------------------------------------------------------------------------------------------------------------------------
      1 |     4 |        298.41 |     298.41 |   171882.6 |   576 |         1 | 1x1x1 |       121.1 | compute |   0.0/  0.0/  0.0 |  459.1/1.80e+07/  inf
      2 |     4 |        335.13 |     335.13 |   193037.4 |   576 |         1 | 1x1x1 |       122.1 | compute |   0.0/  0.0/  0.0 |  459.1/1.80e+07/  inf
      4 |     4 |        371.86 |     371.86 |   214192.2 |   576 |         1 | 1x1x1 |       124.2 | compute |   0.0/  0.0/  0.0 |  459.1/1.80e+07/  inf
      8 |     4 |        408.59 |     408.59 |   235346.9 |   576 |         1 | 1x1x1 |       128.3 | compute |   0.0/  0.0/  0.0 |  459.1/1.80e+07/  inf
     10 |     4 |        420.41 |     420.41 |   242157.3 |   576 |         1 | 1x1x1 |       130.4 | compute |   0.0/  0.0/  0.0 |  459.1/1.80e+07/  inf
     12 |     4 |        422.36 |     422.36 |   243280.0 |   576 |         1 | 1x1x1 |       132.4 | compute |   0.0/  0.0/  0.0 |  459.1/1.80e+07/  inf
     16 |     4 |        422.36 |     422.36 |   243280.0 |   576 |         1 | 1x1x1 |       136.6 | compute |   0.0/  0.0/  0.0 |  459.1/1.80e+07/  inf
      1 |     8 |        283.23 |     566.47 |   163142.8 |   288 |         2 | 1x1x2 |       134.6 | compute |   0.0/  0.0/  0.0 |  435.7/6.77e+06/2.14e+07
      2 |     8 |        318.09 |     636.19 |   183221.9 |   288 |         2 | 1x1x2 |       135.9 | compute |   0.0/  0.0/  0.0 |  435.7/6.77e+06/2.14e+07
      4 |     8 |        352.95 |     705.91 |   203301.0 |   288 |         2 | 1x1x2 |       138.7 | compute |   0.0/  0.0/  0.0 |  435.7/6.77e+06/2.14e+07
      8 |     8 |        387.81 |     775.63 |   223380.2 |   288 |         2 | 1x1x2 |       144.2 | compute |   0.0/  0.0/  0.0 |  435.7/6.77e+06/2.14e+07
     10 |     8 |        399.04 |     798.07 |   229844.2 |   288 |         2 | 1x1x2 |       146.9 | compute |   0.0/  0.0/  0.0 |  435.7/6.77e+06/2.14e+07
     12 |     8 |        400.89 |     801.77 |   230909.8 |   288 |         2 | 1x1x2 |       149.7 | compute |   0.0/  0.0/  0.0 |  435.7/6.77e+06/2.14e+07
     16 |     8 |        400.89 |     801.77 |   230909.8 |   288 |         2 | 1x1x2 |       155.2 | compute |   0.0/  0.0/  0.0 |  435.7/6.77e+06/2.14e+07
      1 |    16 |        252.89 |    1011.55 |   145663.2 |   144 |         4 | 1x1x4 |       162.2 | compute |   0.0/  0.0/  0.0 |  389.1/1.69e+06/1.07e+07
      2 |    16 |        284.01 |    1136.05 |   163591.0 |   144 |         4 | 1x1x4 |       165.0 | compute |   0.1/  0.0/  0.0 |  389.1/1.69e+06/1.07e+07
      4 |    16 |        315.14 |    1260.55 |   181518.8 |   144 |         4 | 1x1x4 |       170.5 | compute |   0.1/  0.0/  0.0 |  389.1/1.69e+06/1.07e+07
      8 |    16 |        346.26 |    2770.09 |   199446.6 |    72 |         8 | 1x1x8 |       133.3 | compute |   0.1/  0.0/  0.0 |  389.1/8.46e+05/5.34e+06
     10 |    16 |        356.28 |    2850.25 |   205218.0 |    72 |         8 | 1x1x8 |       138.8 | compute |   0.1/  0.0/  0.0 |  389.1/8.46e+05/5.34e+06
     12 |    16 |        357.93 |    2863.47 |   206169.5 |    72 |         8 | 1x1x8 |       144.3 | compute |   0.1/  0.0/  0.0 |  389.1/8.46e+05/5.34e+06
     16 |    16 |        357.93 |    2863.47 |   206169.5 |    72 |         8 | 1x1x8 |       155.4 | compute |   0.1/  0.0/  0.0 |  389.1/8.46e+05/5.34e+06
- Higher sustained FLOPs (
llm_cluster_simulator.py:123) lift tokens/GPU to 422 at batch 12 with INT4 weights. - Even at large batches, the intra-rack fabric remains idle, so scaling hinges purely on compute throughput.
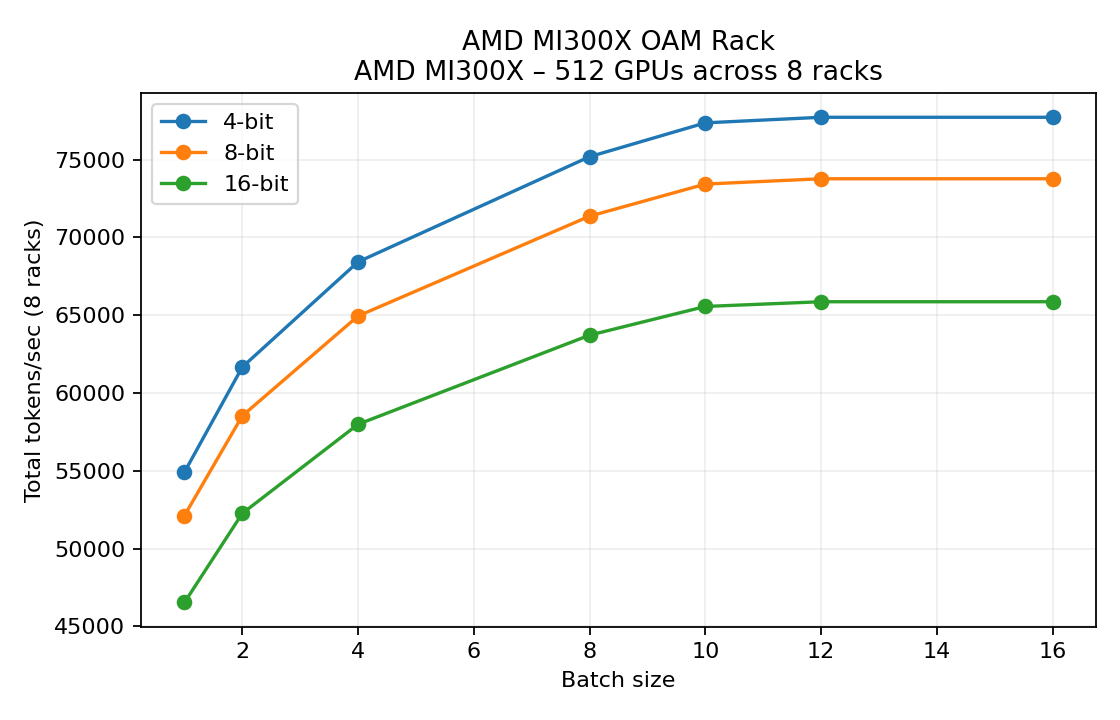
AMD MI300X OAM Rack (8 racks, 512 GPUs)
  Batch | Quant | Tok/GPU(avg) | Inst TPS | Tot TPS | #Inst | GPUs/Inst | TPxPPxEP | Mem/GPU (GB) | Limit | Fabric Load per Inst (GB/s intra/inter/rack) | Bounds tok/GPU(avg) (comp/hbm/comm)
----------------------------------------------------------------------------------------------------------------------------------------------------------------------------------------------
      1 |     4 |        107.24 |     107.24 |    54906.9 |   512 |         1 | 1x1x1 |       119.4 | compute |   0.0/  0.0/  0.0 |  165.0/7.98e+06/  inf
      2 |     4 |        120.44 |     120.44 |    61664.7 |   512 |         1 | 1x1x1 |       120.4 | compute |   0.0/  0.0/  0.0 |  165.0/7.98e+06/  inf
      4 |     4 |        133.64 |     133.64 |    68422.5 |   512 |         1 | 1x1x1 |       122.5 | compute |   0.0/  0.0/  0.0 |  165.0/7.98e+06/  inf
      8 |     4 |        146.84 |     146.84 |    75180.3 |   512 |         1 | 1x1x1 |       126.6 | compute |   0.0/  0.0/  0.0 |  165.0/7.98e+06/  inf
     10 |     4 |        151.09 |     151.09 |    77355.8 |   512 |         1 | 1x1x1 |       128.7 | compute |   0.0/  0.0/  0.0 |  165.0/7.98e+06/  inf
     12 |     4 |        151.79 |     151.79 |    77714.4 |   512 |         1 | 1x1x1 |       130.8 | compute |   0.0/  0.0/  0.0 |  165.0/7.98e+06/  inf
     16 |     4 |        151.79 |     151.79 |    77714.4 |   512 |         1 | 1x1x1 |       134.9 | compute |   0.0/  0.0/  0.0 |  165.0/7.98e+06/  inf
      1 |     8 |        101.79 |     203.57 |    52115.1 |   256 |         2 | 1x1x2 |       132.9 | compute |   0.0/  0.0/  0.0 |  156.6/2.99e+06/9.66e+06
      2 |     8 |        114.31 |     228.63 |    58529.2 |   256 |         2 | 1x1x2 |       134.3 | compute |   0.0/  0.0/  0.0 |  156.6/2.99e+06/9.66e+06
      4 |     8 |        126.84 |     253.69 |    64943.4 |   256 |         2 | 1x1x2 |       137.0 | compute |   0.0/  0.0/  0.0 |  156.6/2.99e+06/9.66e+06
      8 |     8 |        139.37 |     278.74 |    71357.5 |   256 |         2 | 1x1x2 |       142.5 | compute |   0.0/  0.0/  0.0 |  156.6/2.99e+06/9.66e+06
     10 |     8 |        143.40 |     286.81 |    73422.4 |   256 |         2 | 1x1x2 |       145.3 | compute |   0.0/  0.0/  0.0 |  156.6/2.99e+06/9.66e+06
     12 |     8 |        144.07 |     288.14 |    73762.9 |   256 |         2 | 1x1x2 |       148.0 | compute |   0.0/  0.0/  0.0 |  156.6/2.99e+06/9.66e+06
     16 |     8 |        144.07 |     576.27 |    73762.9 |   128 |         4 | 1x1x4 |       105.4 | compute |   0.0/  0.0/  0.0 |  156.6/1.50e+06/4.83e+06
      1 |    16 |         90.88 |     727.05 |    46531.3 |    64 |         8 | 1x1x8 |       112.4 | compute |   0.0/  0.0/  0.0 |  139.8/3.74e+05/2.42e+06
      2 |    16 |        102.07 |     816.53 |    52258.2 |    64 |         8 | 1x1x8 |       115.1 | compute |   0.0/  0.0/  0.0 |  139.8/3.74e+05/2.42e+06
      4 |    16 |        113.25 |     906.02 |    57985.2 |    64 |         8 | 1x1x8 |       120.6 | compute |   0.0/  0.0/  0.0 |  139.8/3.74e+05/2.42e+06
      8 |    16 |        124.44 |     995.50 |    63712.1 |    64 |         8 | 1x1x8 |       131.6 | compute |   0.0/  0.0/  0.0 |  139.8/3.74e+05/2.42e+06
     10 |    16 |        128.04 |    1024.31 |    65555.8 |    64 |         8 | 1x1x8 |       137.2 | compute |   0.1/  0.0/  0.0 |  139.8/3.74e+05/2.42e+06
     12 |    16 |        128.63 |    1029.06 |    65859.7 |    64 |         8 | 1x1x8 |       142.7 | compute |   0.1/  0.0/  0.0 |  139.8/3.74e+05/2.42e+06
     16 |    16 |        128.63 |    1029.06 |    65859.7 |    64 |         8 | 1x2x4 |       105.4 | compute |   0.1/  0.0/  0.0 |  139.8/7.48e+05/2.42e+06
- Lower sustained FLOPs (
llm_cluster_simulator.py:105) yield ~152 tokens/GPU at batch 12 with INT4 weights. - Expert parallelism scales from 1->8 as precision grows, keeping per-GPU memory under the 192 GB cap.
AMD MI355X OAM Rack (8 racks, 512 GPUs)

  Batch | Quant | Tok/GPU(avg) | Inst TPS | Tot TPS | #Inst | GPUs/Inst | TPxPPxEP | Mem/GPU (GB) | Limit | Fabric Load per Inst (GB/s intra/inter/rack) | Bounds tok/GPU(avg) (comp/hbm/comm)
----------------------------------------------------------------------------------------------------------------------------------------------------------------------------------------------
      1 |     4 |        135.22 |     135.22 |    69230.5 |   512 |         1 | 1x1x1 |       119.4 | compute |   0.0/  0.0/  0.0 |  208.0/1.01e+07/  inf
      2 |     4 |        151.86 |     151.86 |    77751.2 |   512 |         1 | 1x1x1 |       120.4 | compute |   0.0/  0.0/  0.0 |  208.0/1.01e+07/  inf
      4 |     4 |        168.50 |     168.50 |    86271.8 |   512 |         1 | 1x1x1 |       122.5 | compute |   0.0/  0.0/  0.0 |  208.0/1.01e+07/  inf
      8 |     4 |        185.14 |     185.14 |    94792.5 |   512 |         1 | 1x1x1 |       126.6 | compute |   0.0/  0.0/  0.0 |  208.0/1.01e+07/  inf
     10 |     4 |        190.50 |     190.50 |    97535.6 |   512 |         1 | 1x1x1 |       128.7 | compute |   0.0/  0.0/  0.0 |  208.0/1.01e+07/  inf
     12 |     4 |        191.38 |     191.38 |    97987.8 |   512 |         1 | 1x1x1 |       130.8 | compute |   0.0/  0.0/  0.0 |  208.0/1.01e+07/  inf
     16 |     4 |        191.38 |     191.38 |    97987.8 |   512 |         1 | 1x1x1 |       134.9 | compute |   0.0/  0.0/  0.0 |  208.0/1.01e+07/  inf
      1 |     8 |        128.34 |     256.68 |    65710.3 |   256 |         2 | 1x1x2 |       132.9 | compute |   0.0/  0.0/  0.0 |  197.4/3.78e+06/1.22e+07
      2 |     8 |        144.14 |     288.27 |    73797.7 |   256 |         2 | 1x1x2 |       134.3 | compute |   0.0/  0.0/  0.0 |  197.4/3.78e+06/1.22e+07
      4 |     8 |        159.93 |     319.86 |    81885.1 |   256 |         2 | 1x1x2 |       137.0 | compute |   0.0/  0.0/  0.0 |  197.4/3.78e+06/1.22e+07
      8 |     8 |        175.73 |     351.46 |    89972.6 |   256 |         2 | 1x1x2 |       142.5 | compute |   0.0/  0.0/  0.0 |  197.4/3.78e+06/1.22e+07
     10 |     8 |        180.81 |     361.63 |    92576.1 |   256 |         2 | 1x1x2 |       145.3 | compute |   0.0/  0.0/  0.0 |  197.4/3.78e+06/1.22e+07
     12 |     8 |        181.65 |     363.30 |    93005.3 |   256 |         2 | 1x1x2 |       148.0 | compute |   0.0/  0.0/  0.0 |  197.4/3.78e+06/1.22e+07
     16 |     8 |        181.65 |     726.60 |    93005.3 |   128 |         4 | 1x1x4 |       105.4 | compute |   0.0/  0.0/  0.0 |  197.4/1.89e+06/6.10e+06
      1 |    16 |        114.59 |     916.72 |    58669.9 |    64 |         8 | 1x1x8 |       112.4 | compute |   0.0/  0.0/  0.0 |  176.3/4.72e+05/3.05e+06
      2 |    16 |        128.69 |    1029.54 |    65890.8 |    64 |         8 | 1x1x8 |       115.1 | compute |   0.1/  0.0/  0.0 |  176.3/4.72e+05/3.05e+06
      4 |    16 |        142.80 |    1142.37 |    73111.7 |    64 |         8 | 1x1x8 |       120.6 | compute |   0.1/  0.0/  0.0 |  176.3/4.72e+05/3.05e+06
      8 |    16 |        156.90 |    1255.20 |    80332.6 |    64 |         8 | 1x1x8 |       131.6 | compute |   0.1/  0.0/  0.0 |  176.3/4.72e+05/3.05e+06
     10 |    16 |        161.44 |    1291.52 |    82657.3 |    64 |         8 | 1x1x8 |       137.2 | compute |   0.1/  0.0/  0.0 |  176.3/4.72e+05/3.05e+06
     12 |    16 |        162.19 |    1297.51 |    83040.5 |    64 |         8 | 1x1x8 |       142.7 | compute |   0.1/  0.0/  0.0 |  176.3/4.72e+05/3.05e+06
     16 |    16 |        162.19 |    1297.51 |    83040.5 |    64 |         8 | 1x2x4 |       105.4 | compute |   0.1/  0.0/  0.0 |  176.3/9.44e+05/3.05e+06
- MI355X inherits the MI300X topology but with stronger blocks: sustained FLOPs jump to 14.5 TF/s, lifting total throughput to ~98 k tokens/s at batch 12 INT4.
- Fabric load remains low; further tuning should focus on kernel efficiency or additional racks rather than networking.
Metric glossary
- Tok/GPU(avg): cluster-average tokens/s per active GPU (total rack TPS divided by total active GPUs); ideal for hardware-to-hardware comparisons.
- Inst TPS: sustained tokens/s for a single model instance under the chosen parallel plan.
- Total TPS: aggregate throughput across all eight racks of the preset.
- Limit: subsystem that capped throughput (
compute,hbm,comm). - Bounds tok/GPU(avg): theoretical ceilings derived from compute, HBM, and communication throughput before efficiency scaling.
- Fabric load: effective bandwidth consumption per instance on the intra-server, inter-server, and inter-rack links.
Because the simulator models steady-state decode, it omits prefill latency; extend the model if you need prompt-heavy workloads.
Modeling notes
Utilisation ceilings
The marketing peak numbers (e.g. 2,500 TFLOPs for GB200) assume perfect FP8 matmuls. Real decode workloads rarely exceed 20-30 % utilisation because they thrash the KV cache and wait on collectives. The sustained FLOPs in GPU_PRESETS (llm_cluster_simulator.py:105-128) reflect decode-mode telemetry from public benchmarks. Replace them with your own nsys/ncu traces if you have better data.
The compute ceiling is estimated with:
compute_bound_per_gpu ~ (sustained_flops * compute_scale) / flops_per_token
where compute_scale comes from QUANT_PRESETS, and flops_per_token is derived from the active parameter count in the MoE (llm_cluster_simulator.py:70-101). If observed tokens/GPU exceed the ceiling, tighten those inputs.
Parameter provenance
sustained_flops: decode-mode throughput after utilisation losses (20-35 % below peak). Update with measurements if available.hbm_bw: effective HBM bandwidth assuming 60-70 % utilisation on decode-heavy kernels.compute_scale: empirical uplift from lower-precision kernels; tune to your INT4/INT8 stack.kv_bytes_per_elem: defaults assume FP16 KV for 16-bit, FP8/INT8 for 8-bit, and compressed FP8 for 4-bit variants.- Interconnect bandwidths (
intra_server_bw,inter_server_bw,inter_rack_bw): sourced from vendor topology guides; swap in NCCL microbenchmark results for accuracy.
Qwen3 mixture-of-experts assumptions
- Default: top-8-of-128 MoE with 88 % of parameters in experts and 12 % shared; adjust
expert_param_fraction,shared_param_fraction, andactive_expertsto match your checkpoint. - Expert traffic is modelled as an all-to-all exchange of FP16 activations with a 2x dispatch factor (
moe_dispatch_factor); raise it if packing overhead is higher. - Expert-parallel degrees (
ep_candidates) multiply the tensor x pipeline mesh; shared weights replicate, expert weights shard.
Why GB200 outpaces MI355X
- Per-GPU sustained FLOPs: 24 TF/s for GB200 versus 14.5 TF/s for MI355X (
llm_cluster_simulator.py:112-119), a 1.65x gap that dominates when runs are compute bound. - Rack population: NVL72 racks host 72 GPUs each (9 servers x 8 GPUs) whereas the MI355X racks hold 64 (
llm_cluster_simulator.py:132-171), adding ~12.5 % more devices to the GB200 sweep. - Aggregate compute wins: multiplying the factors above gives ~1.9x more usable FLOPs for GB200, so total TPS lands just under 2x higher despite identical batch sizes and quant modes.
References
- SemiAnalysis: AMD Advancing AI - MI350X and beyond
- Qwen3 architecture primer: Sebastian Raschka’s deep dive
- NVIDIA GB racks architecture
- AMD racks
Want me to work with you on this?
Do you want to work together to optimize your data center, racks, nodes, networking, storage, operations? Contact me!
about the author
I have more than 20 years of experience in neural networks in both hardware and software (a rare combination). About me: Medium, webpage, Scholar, LinkedIn.
If you found this article useful, please consider a donation to support more tutorials and blogs. Any contribution can make a difference!